weAnalyse

weAnalyse extends monitoring with an additional analysis layer. It is not a rigid off-the-shelf product, but a flexible solution framework based on a proven toolchain and our extensive expertise in software development and analytics. We deliberately chose not to offer a single “one-size-fits-all” solution, but a modular set of technologies and components that we tailor to your needs within the scope of a customer project.
In practice this means: instead of a fixed configuration, we can provide a solution that is precisely aligned with your specific requirements. We bring not only the right technologies to the table, but also the experience to illuminate your individual use cases from all relevant angles. The result is a solution that is not only functional, but also integrates seamlessly into your existing infrastructure.
Multidimensional time series – from raw signal to process understanding
In industrial plants, process knowledge rarely arises from a single signal, but from the interaction of many measurement and control values. weAnalyse supports the analysis of large historical data pools, even when signals are sampled at different rates or contain gaps over longer periods. Through filtering, aggregation and structured signal sets, you can compare operating states, detect trends and test hypotheses – not just over minutes, but over weeks and months. This allows you to derive robust correlations between parameters and use them as a basis for optimisation or quality assurance.

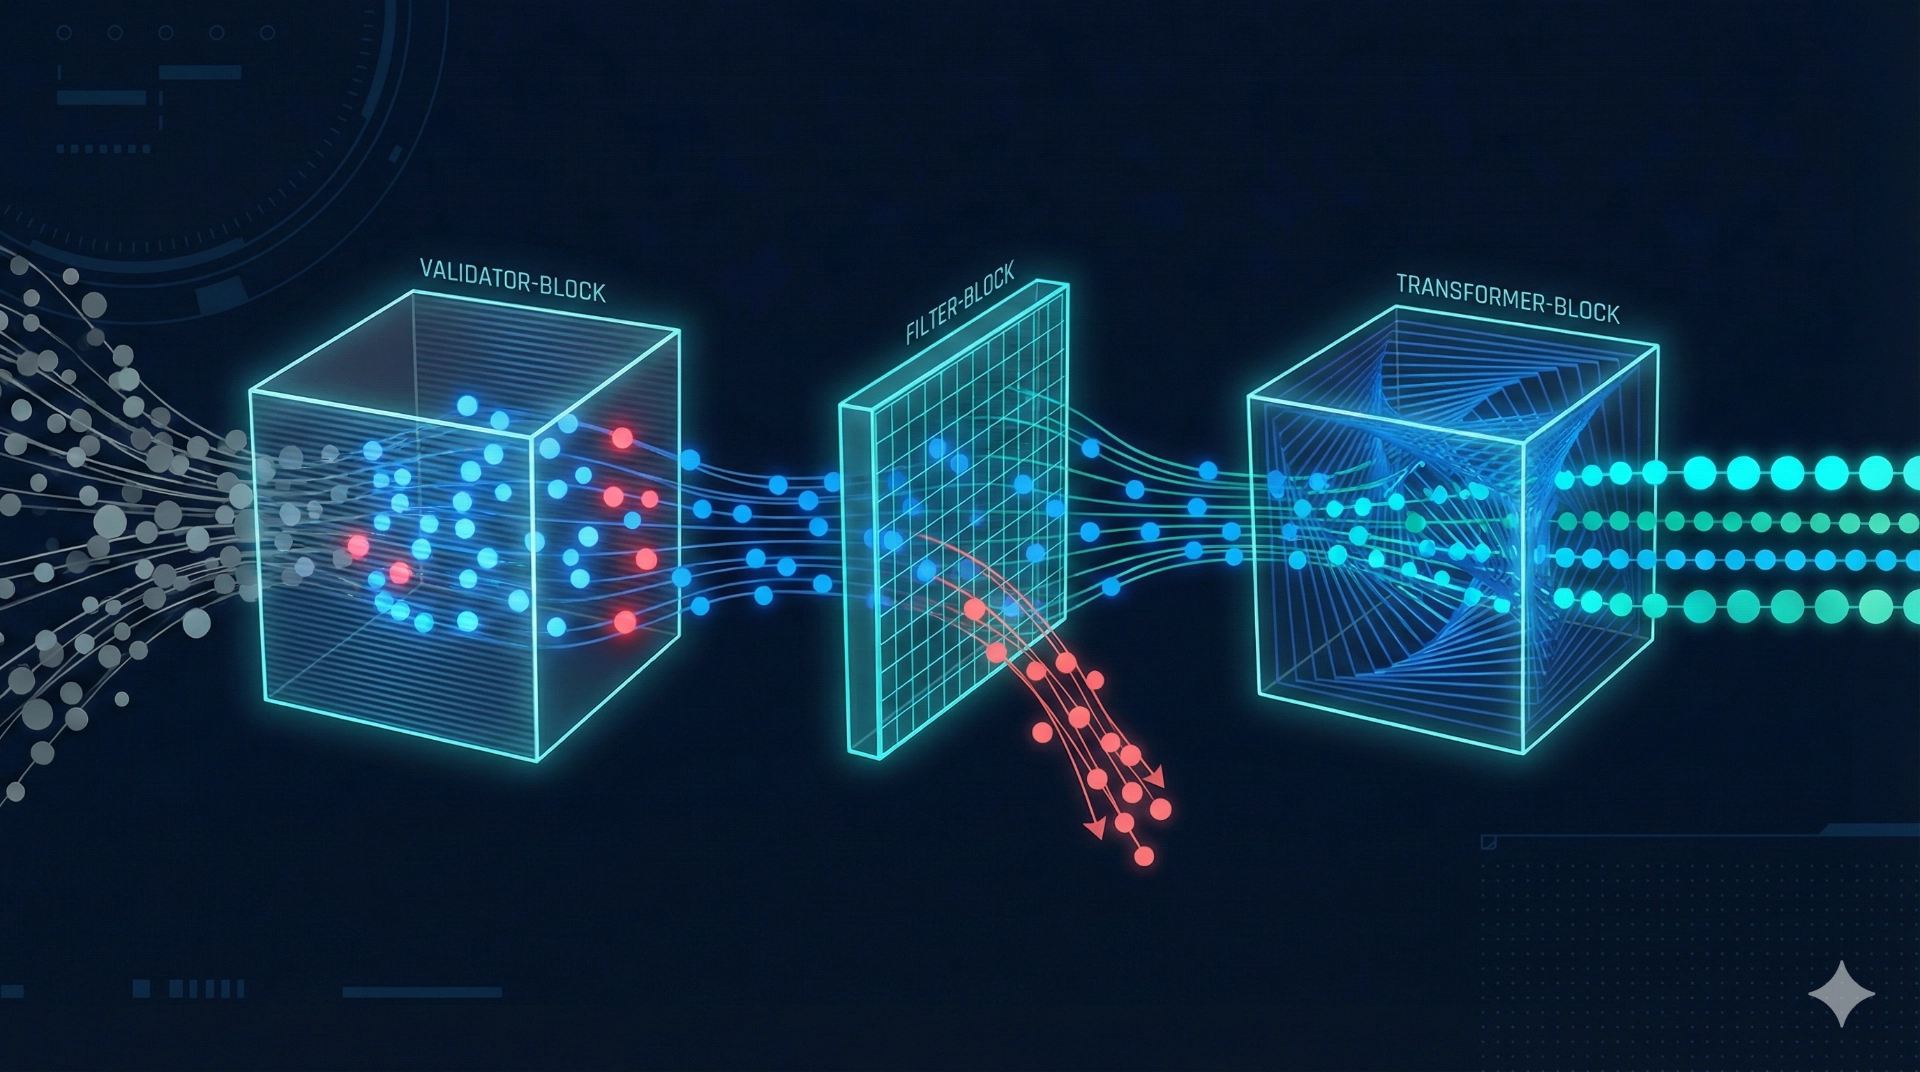
Data quality & plausibility – the foundation of any analysis
Before thresholds are defined or models are trained, it must be clear whether the data is actually reliable. weAnalyse provides functions to check sampling rates, visualise outages and gaps, and identify outliers, jumps or drift over time. This plausibility checking is crucial to avoid false alarms and to correctly interpret process deviations. The benefit becomes particularly clear with large data volumes: inconsistencies are detected systematically instead of only becoming visible once an error occurs.
Anomaly detection – detecting deviations, narrowing down fault patterns
Anomalies can indicate unexpected process behaviour, sensor faults or gradual changes in the system. weAnalyse supports generic detection of such deviations in order to identify potential fault patterns at an early stage – even when the exact root cause is initially unknown. This makes it possible to narrow down critical phases more quickly and place them in the context of other signals. Anomaly detection is therefore not an end in itself, but a tool to understand disturbances faster, make maintenance more plannable and strengthen quality assurance.
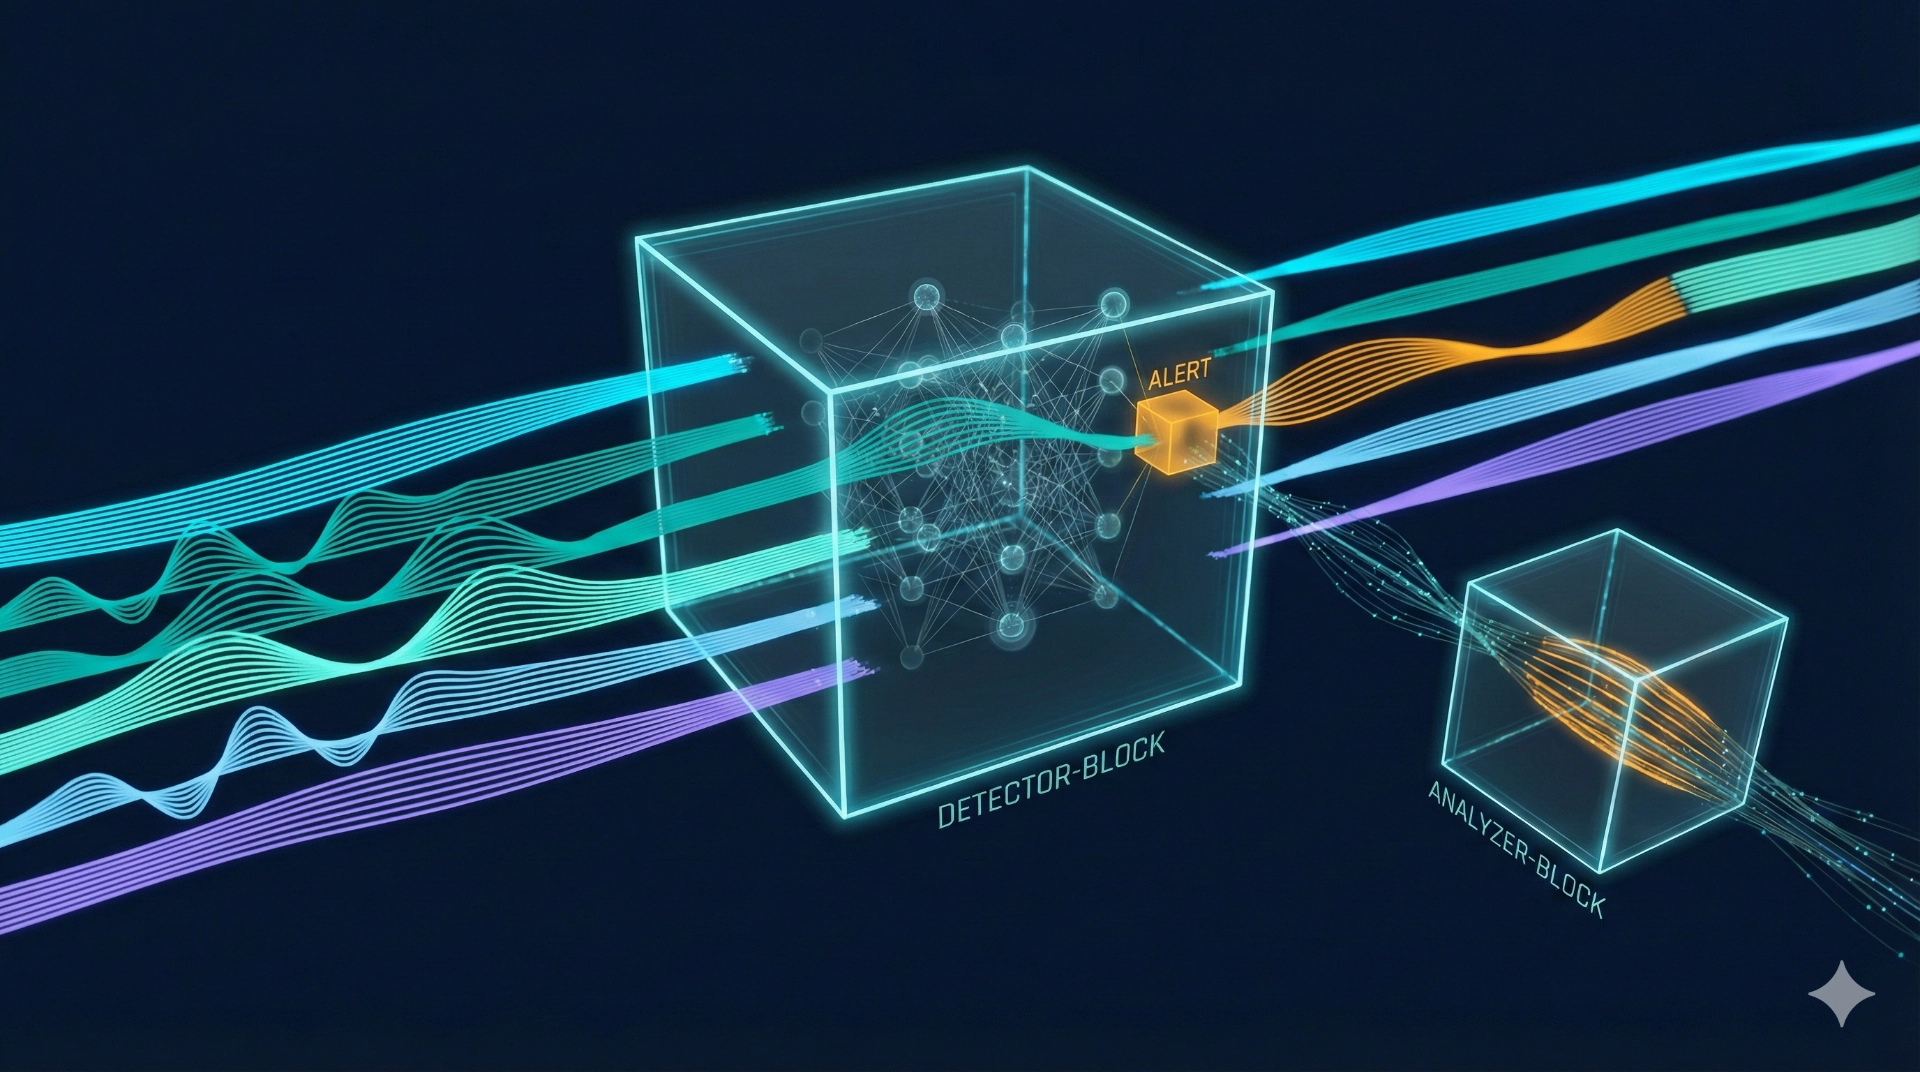
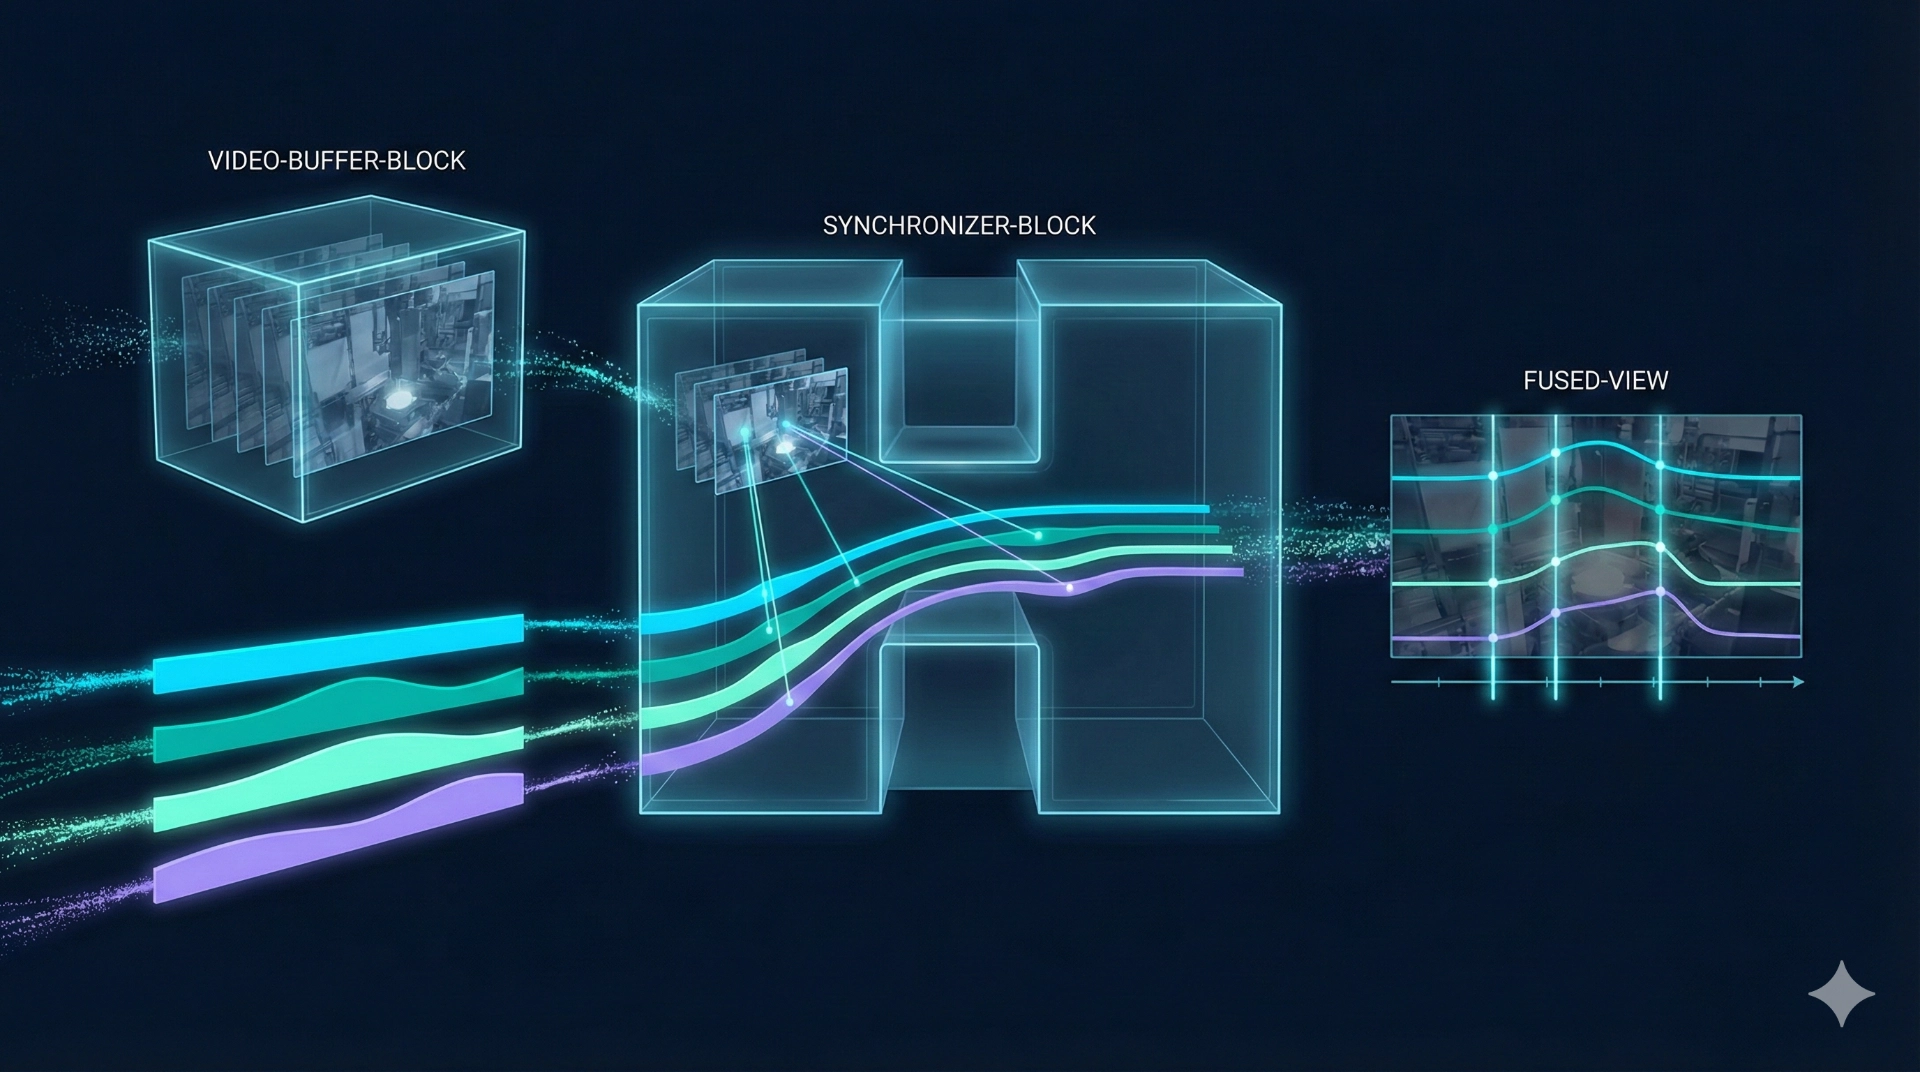
Image and video analysis – turning visual process data into usable measurements
Many quality and process questions can only be assessed visually: surfaces, seams, material behaviour or process stability. In practice, however, image and video recordings are often just archived without targeted access or analytical context. weAnalyse integrates a scalable image and video database (developed in-house) that treats visual data as measurement data: selectable via time windows, searchable via metadata and synchronisable with process parameters. This creates a shared analysis context across video, sensor data and control – ideal for root cause analysis and visual quality assurance.
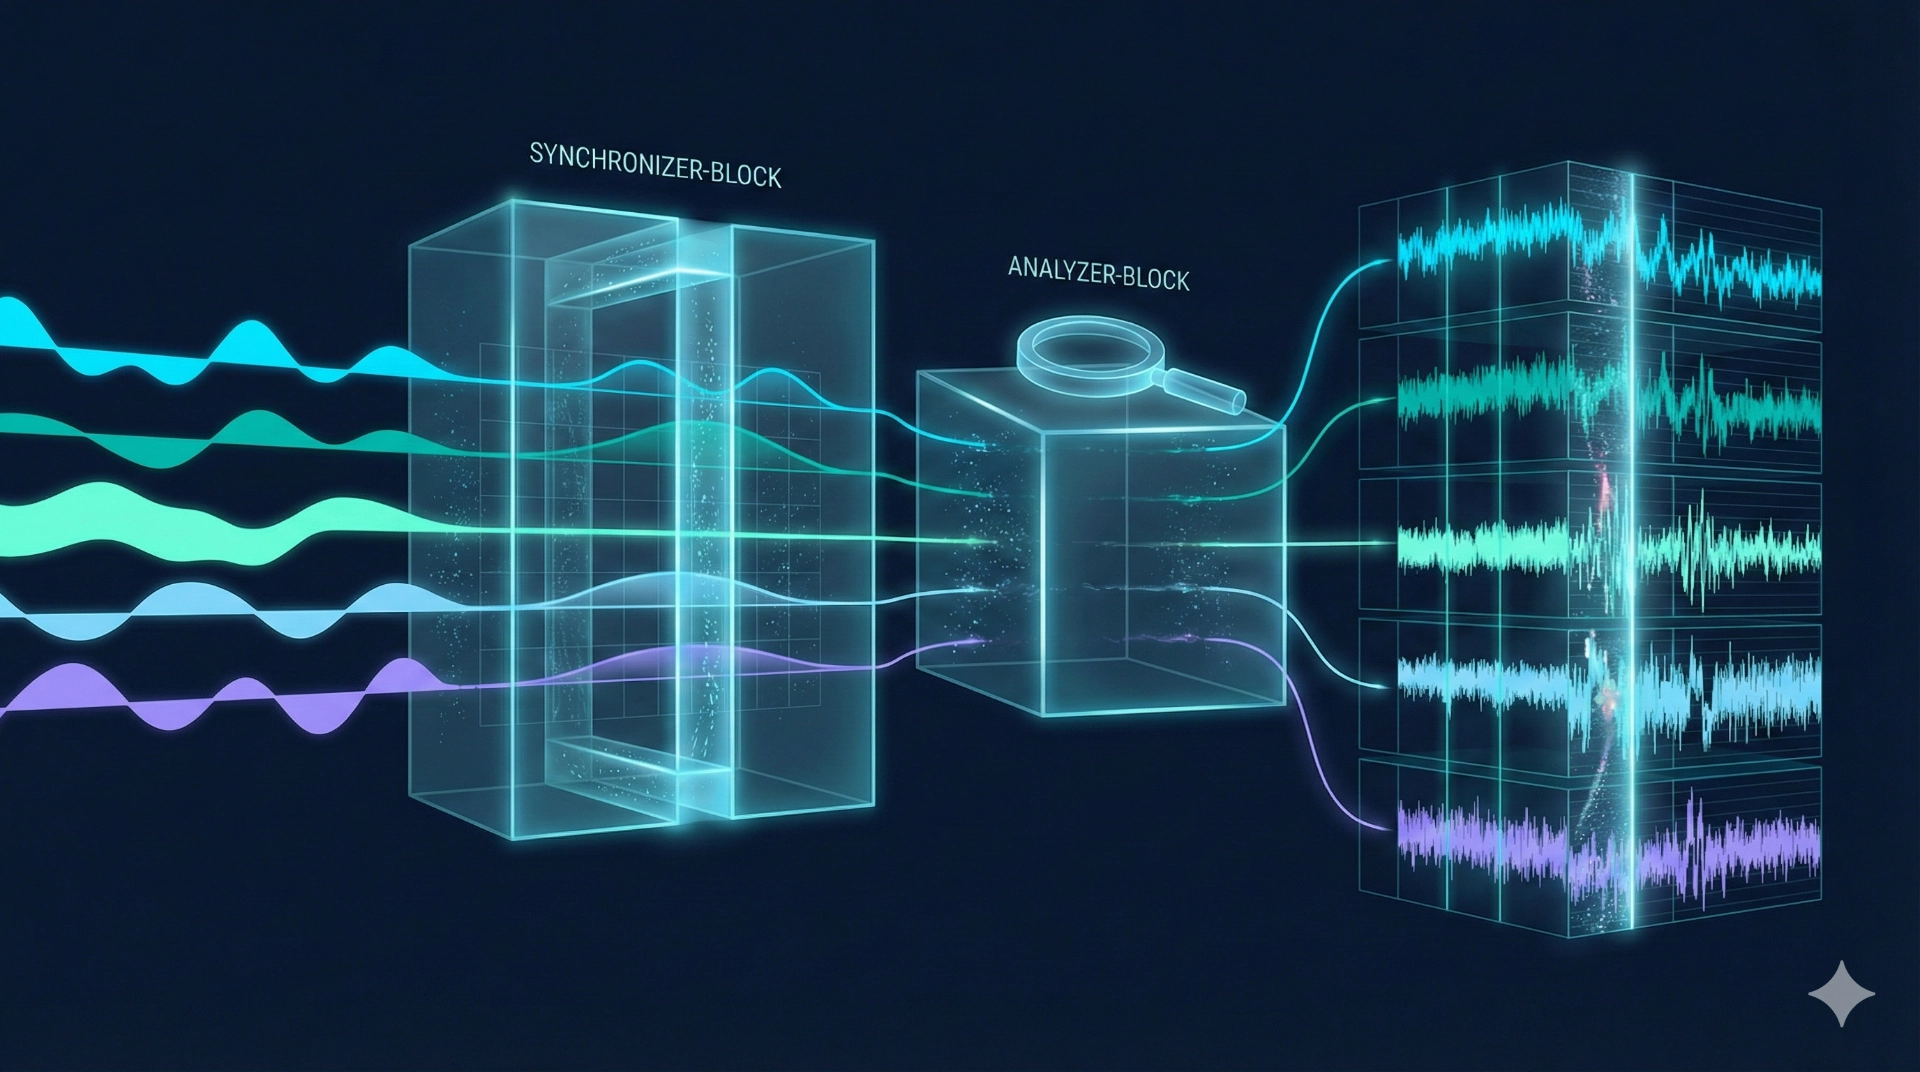
Visualisation that scales – signal sets, shared zooming, aggregation & detail
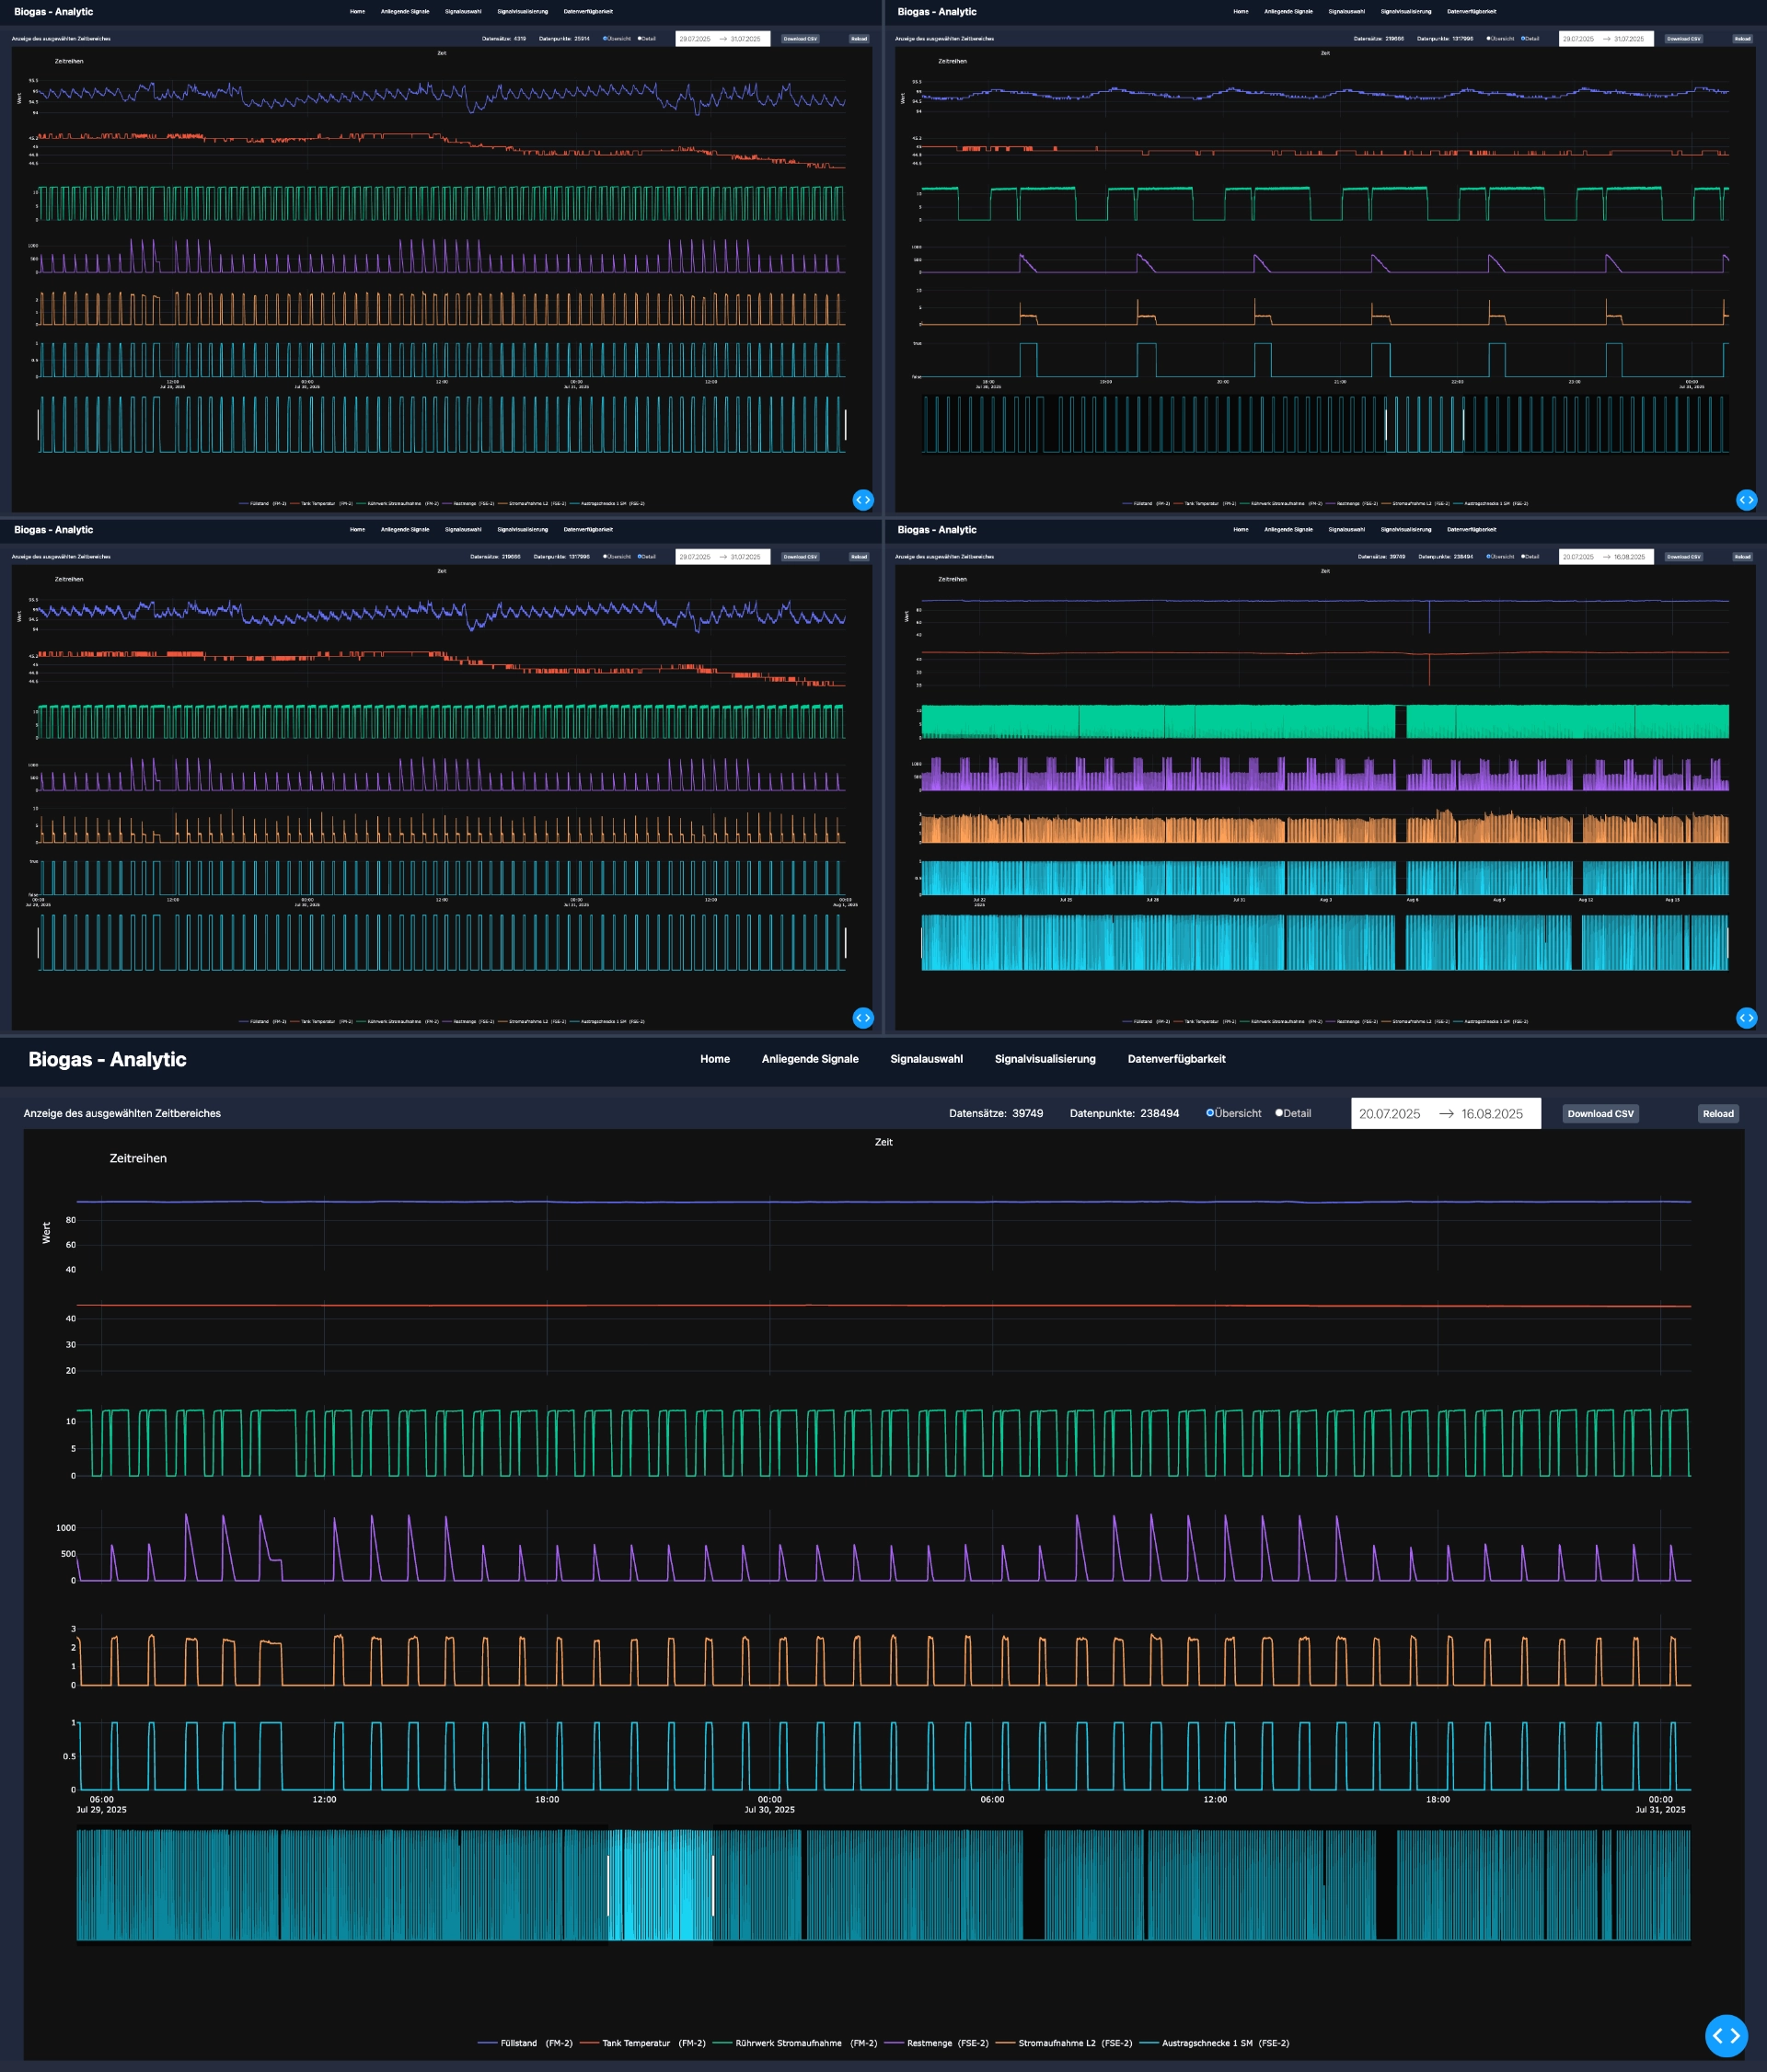
Classic charts often reach their limits with multidimensional time series because different value ranges and many signals cannot be meaningfully displayed in a single view. weAnalyse therefore relies on specialised visualisation: signals are shown as stacked individual plots with a shared time axis so that each signal can fully preserve its geometric shape. A shared zoom and pan mechanism affects all charts at once; in addition, you can switch between aggregated overviews and detailed resolutions. This representation enables precise ad-hoc analyses – especially for high-resolution data and long histories.
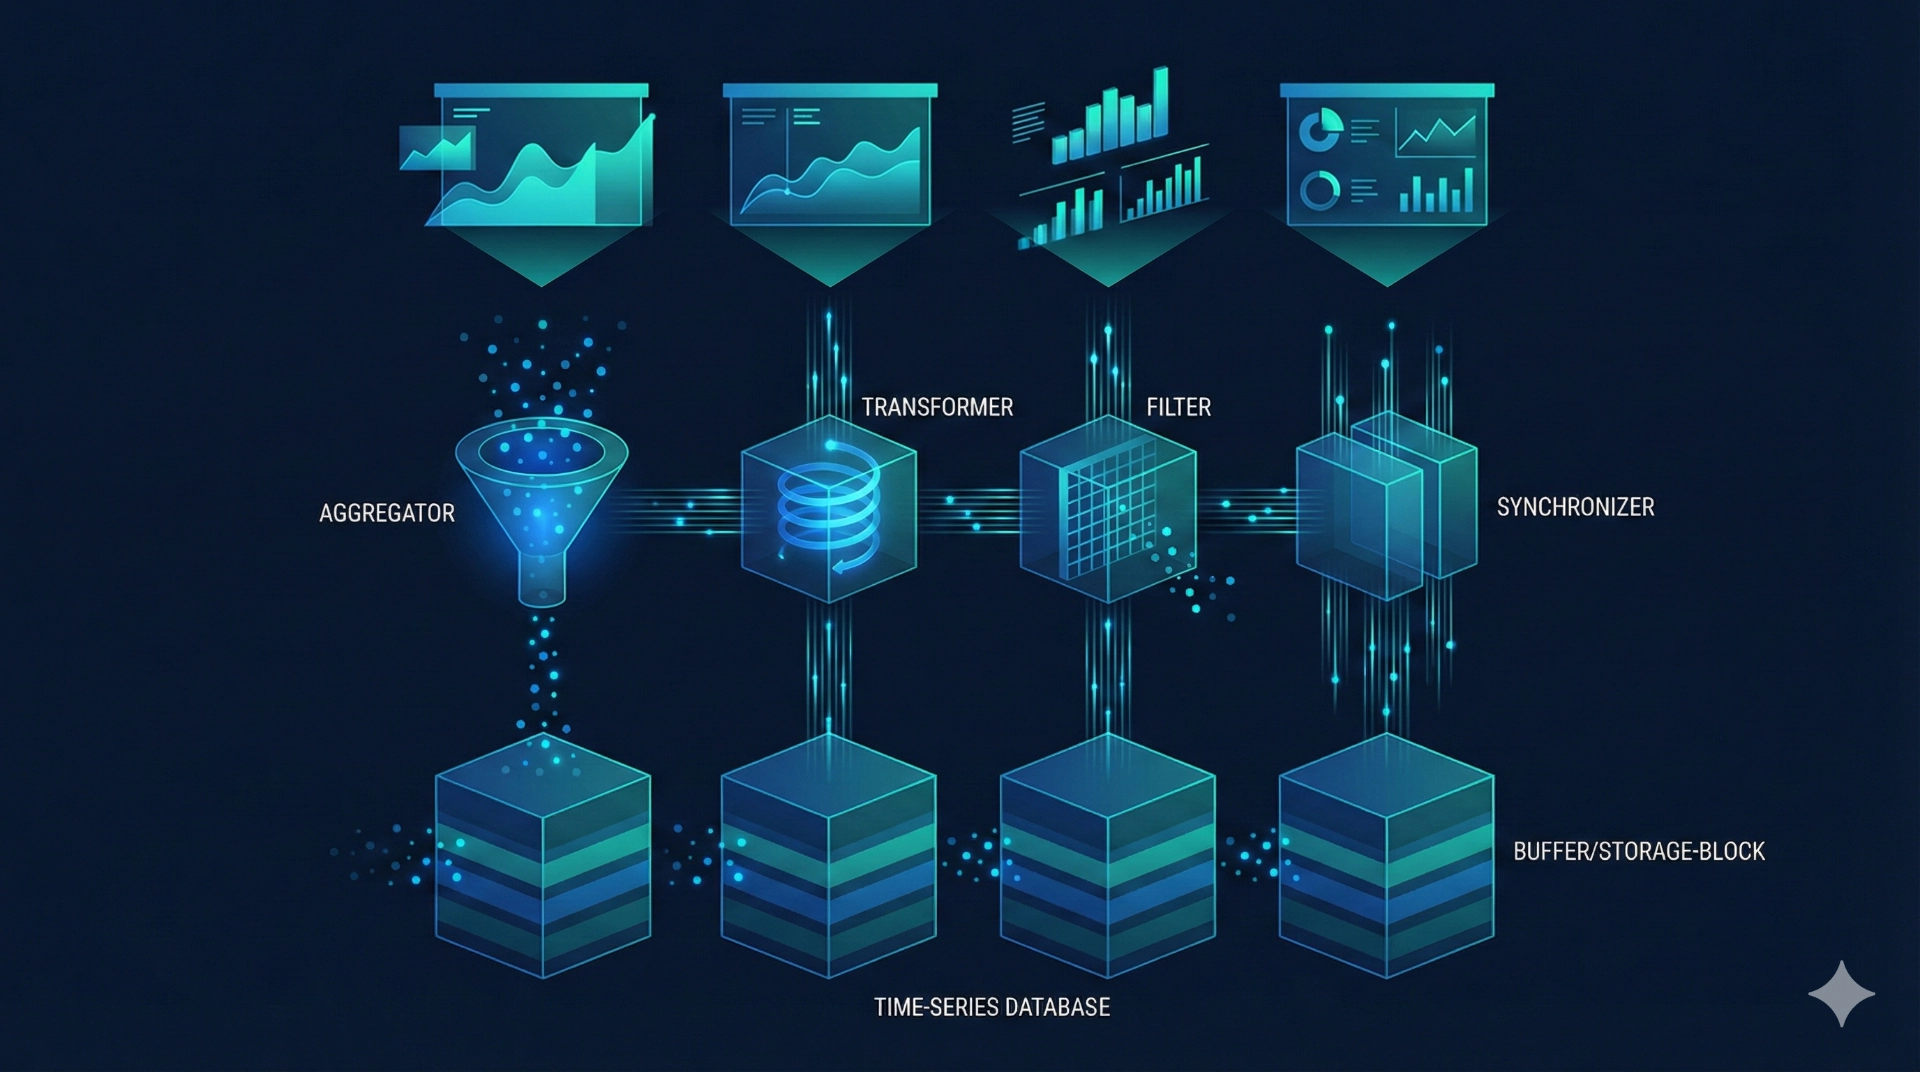
Architecture & performance – interactively analysing large data volumes
Historical analysis across long time periods quickly involves millions to hundreds of millions of records. weAnalyse is designed not only to store such data volumes, but also to analyse them interactively. To achieve this, we use a high-performance analytics engine based on Polars as well as a scalable time-series data store (e.g. InfluxDB 3, GreptimeDB). GreptimeDB in particular offers advantages for cloud-native scaling and long-term histories. This is complemented by our own image/video database to manage visual data efficiently as well. The result is an analysis environment that responds quickly and provides robust pre-analyses.
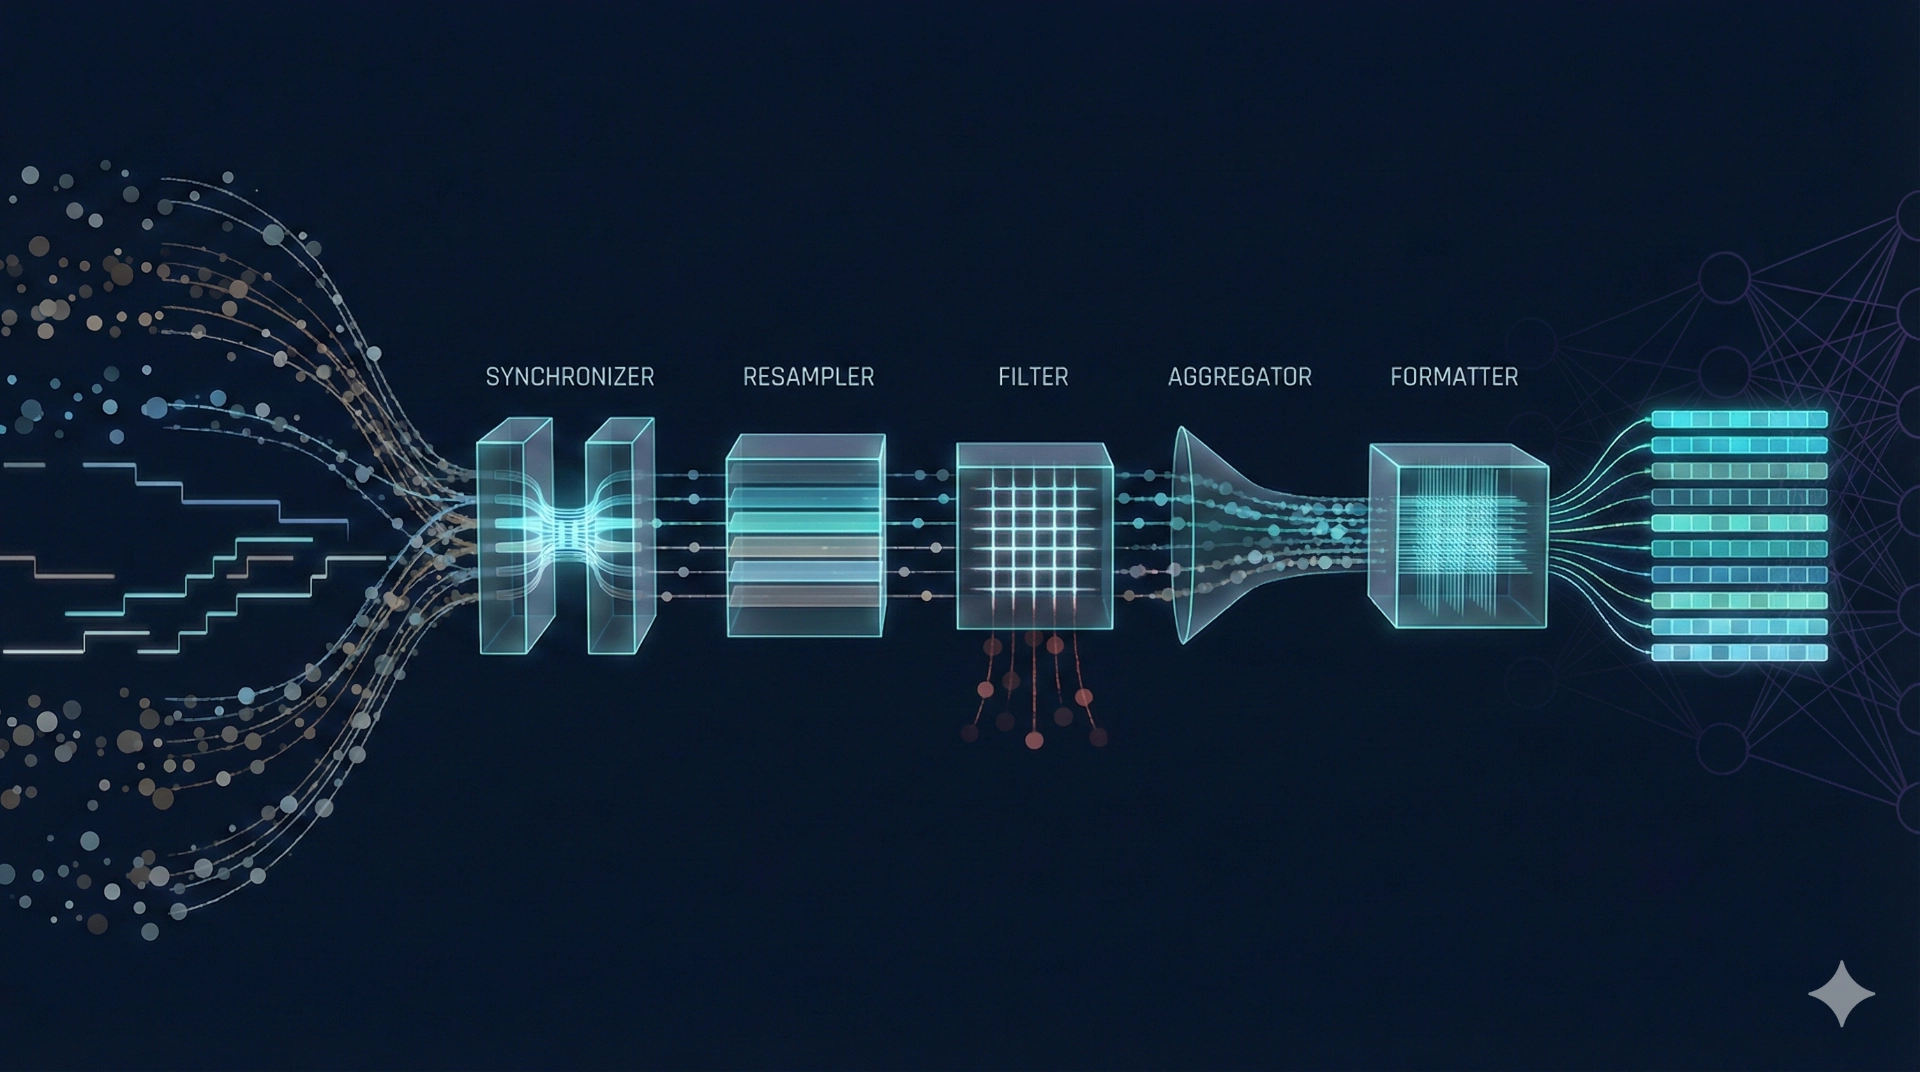
AI and ML preparation – turning data into reliable training foundations
Machine learning is only as good as the data it is built on. weAnalyse supports you in synchronising and resampling time series and converting them into consistent training datasets – including context from operating states, segments and relevant process parameters. Visual data can likewise be reliably linked via metadata and timelines and prepared for later models. This creates a transparent data foundation for forecasts, quality predictions or condition monitoring – without subsequent modelling being hindered by data chaos or lacking plausibility.
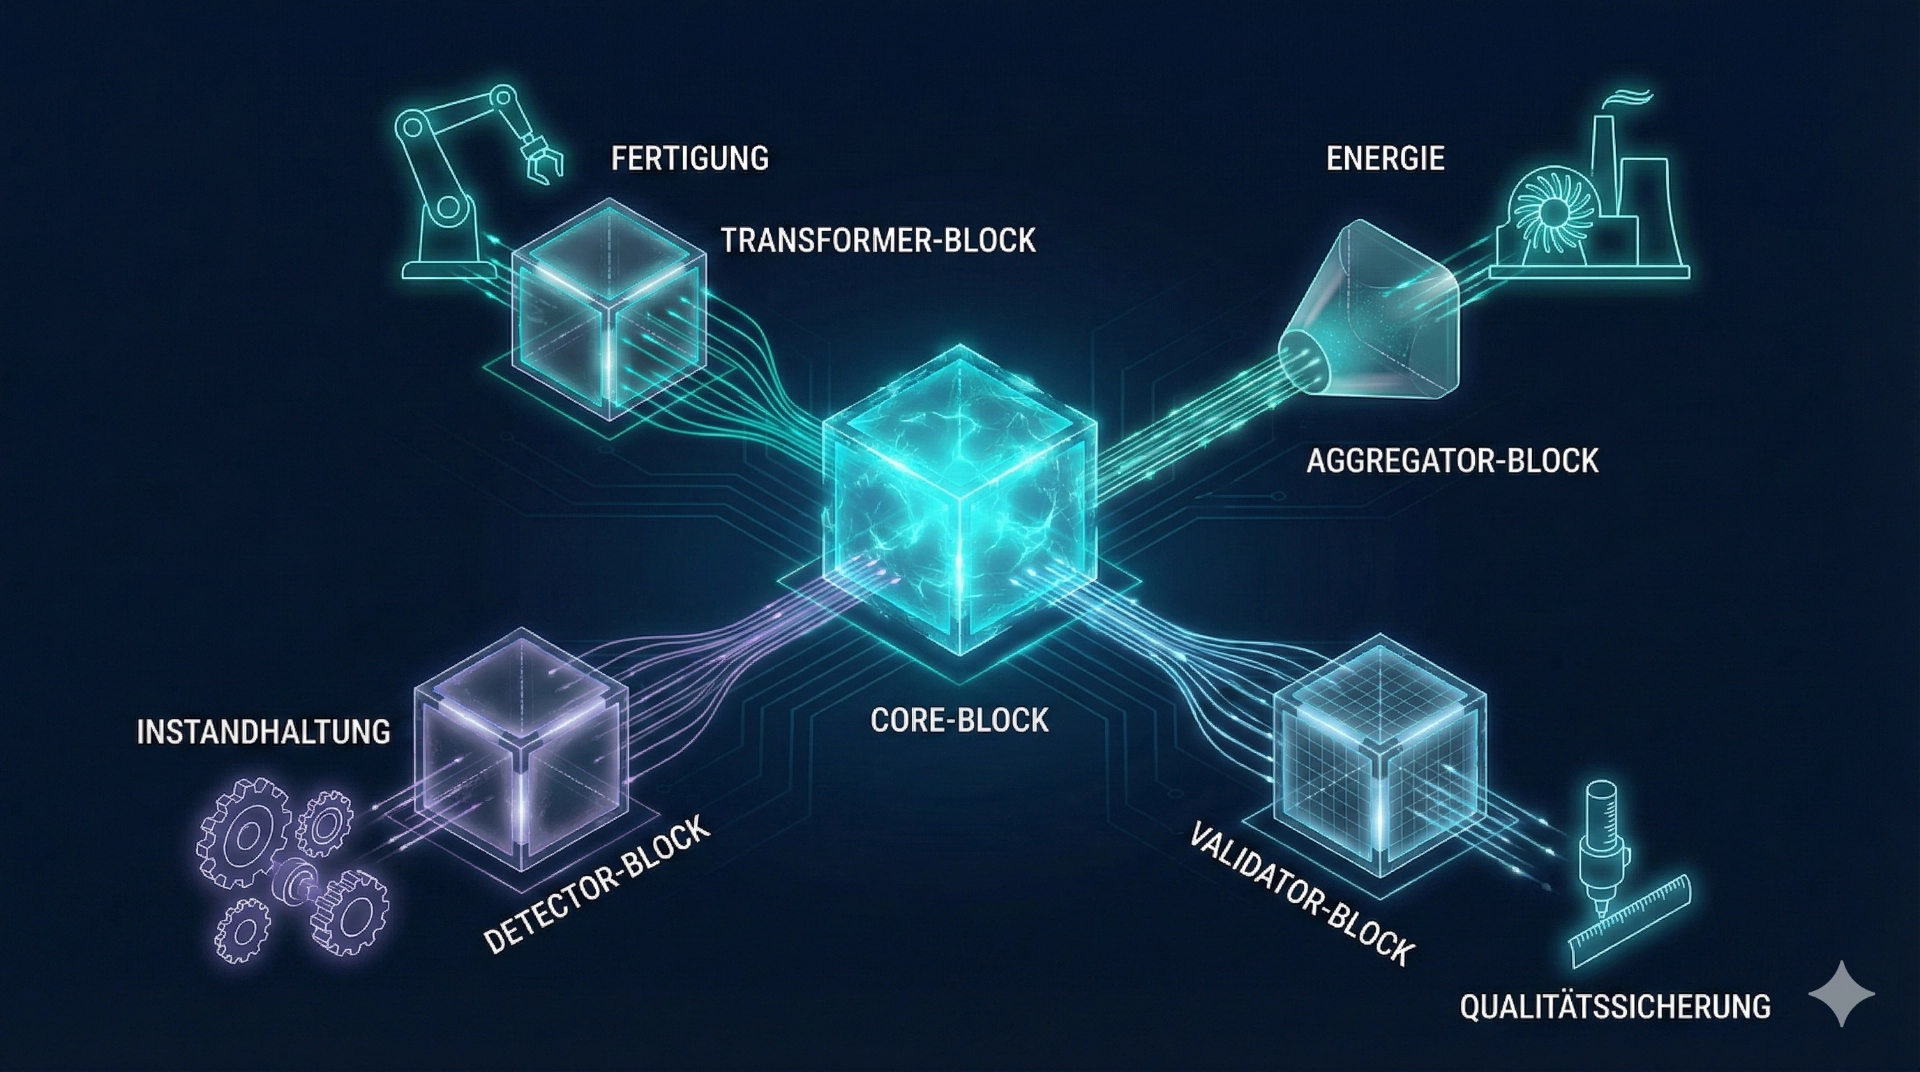
Use cases – from industrial processes to energy plants
weAnalyse can be used across industries – wherever many signals, long histories or visual process data come together. Typical application areas include production processes (e.g. precision machining, laser, welding or robot processes), plant operation and power generation, as well as quality assurance and maintenance. What matters is not the industry, but the analytical goal: ensuring data quality, understanding process behaviour, detecting deviations and reliably preparing optimisation or AI projects.
Solution example – biogas: historical analysis, plausibility and thresholds
In the biogas domain, weAnalyse has been used to derive robust insights from heterogeneous time series (substrate feed, agitator, temperatures, gas composition). Alongside plausibility checks, the focus was on deriving reliable thresholds and analysing atypical process histories. The specialised visualisation makes it possible to examine many signals with a shared time axis without value ranges destroying readability. The result: comprehensible limits, faster root cause analysis and a reliable foundation for downstream forecasting.